One Monday morning, when I opened the Jenkins dashboard, it was unusually slow to load.
Thinking "Hmm, it's kind of heavy today," I pressed the Replay button. The build started running, but after a while, it stopped with a fatal: write error: Bad file descriptor error. Git clone was failing. A process that should normally complete in seconds was timing out as the transfer speed gradually decreased from 77KB/s to 51KB/s.
504 Gateway Time-out errors were also occurring frequently. We access Jenkins through ALB, but it wouldn't return a response even after waiting 60 seconds.
"Something is definitely wrong."
That's when approximately 3 hours of investigation began.
Initial Hypothesis: Network or Temporary Issue?
Looking at the error logs, I/O errors were occurring during Git clone operations. My first thought was "Could this be a temporary network issue?" Since the transfer speed was gradually decreasing, the connection might be becoming unstable.
However, after thinking it through, that didn't make sense.
Looking at the error logs again, the pipeline-groovy-lib plugin was failing while fetching the Shared Library. This is a process that runs on the Controller side. If Jenkins as a whole is slow, there's a high possibility that the Controller's resources are being squeezed.
"I see, it might be a Controller-side problem."
I changed direction. I decided to check CloudWatch metrics.
Reading CloudWatch Metrics
First, I checked the EC2 instance metrics.
- CPUUtilization: Usually 0-5%, with occasional spikes around 30%
- Network In/Out: Similarly, some spikes but generally normal

No noticeable anomalies in CPU or network.
Next, I looked at disk metrics.
- VolumeAvgWriteLatency (Write Latency): Usually around 0.7 seconds
- There was a spike around 01/24 reaching about 1.4 seconds, but it has settled down since
- VolumeAvgReadLatency (Read Latency): Nearly 0 seconds, stable

For a moment, I thought "the 01/24 spike looks suspicious," but looking closer, it has settled down now. This alone doesn't explain everything.
"It's definitely a disk I/O problem, but I can't find decisive evidence in the EBS metrics..."
EBS or EFS? — The Invisible Suspect
Then, a question came to mind.
"Wait, this Jenkins is using EFS, not EBS."
I double-checked the EBS metrics just to be sure, but there didn't seem to be any particular issues. On the other hand, when I opened the EFS metrics—
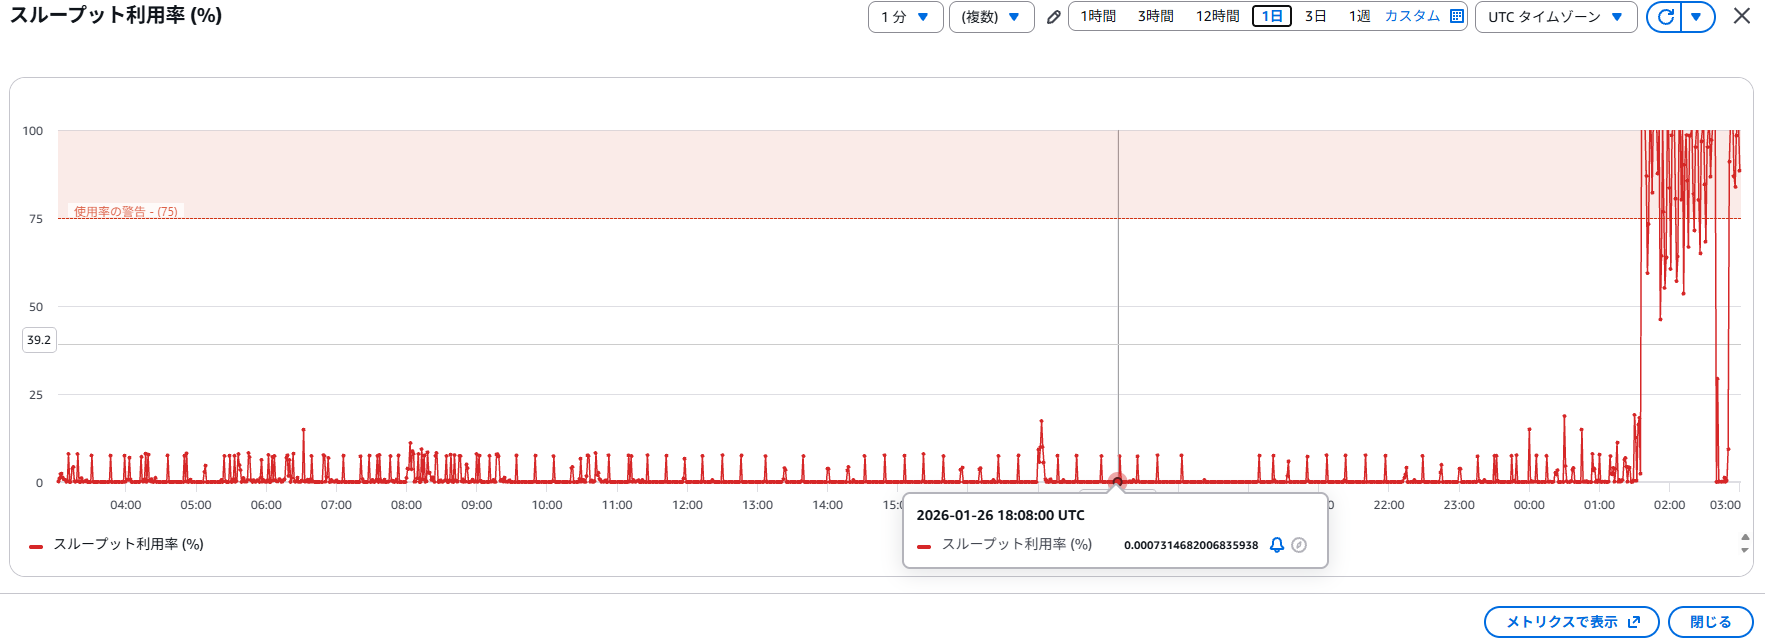
- Throughput Utilization: Frequent spikes reaching 100% between 00:00-03:00
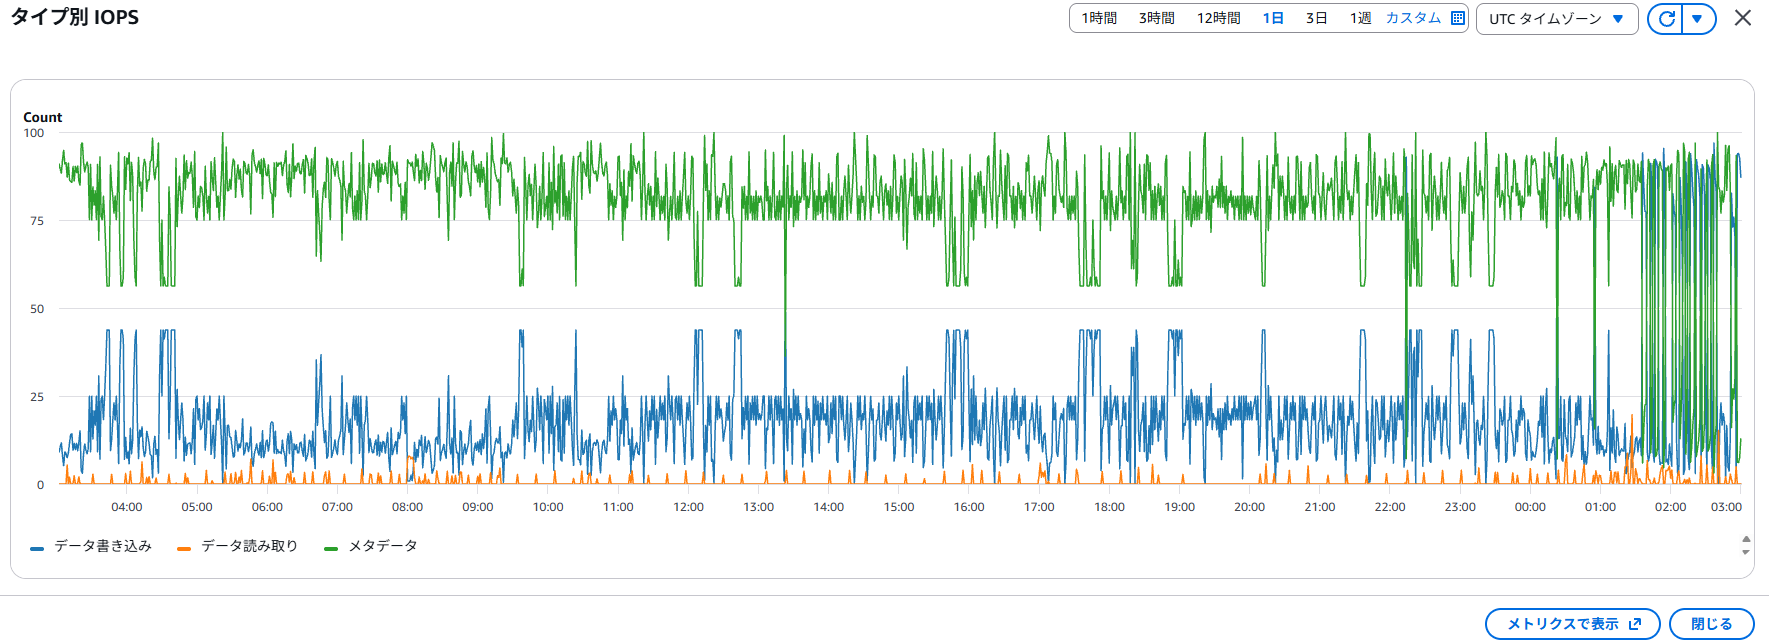
- IOPS: Metadata operations (green graph) are dominant
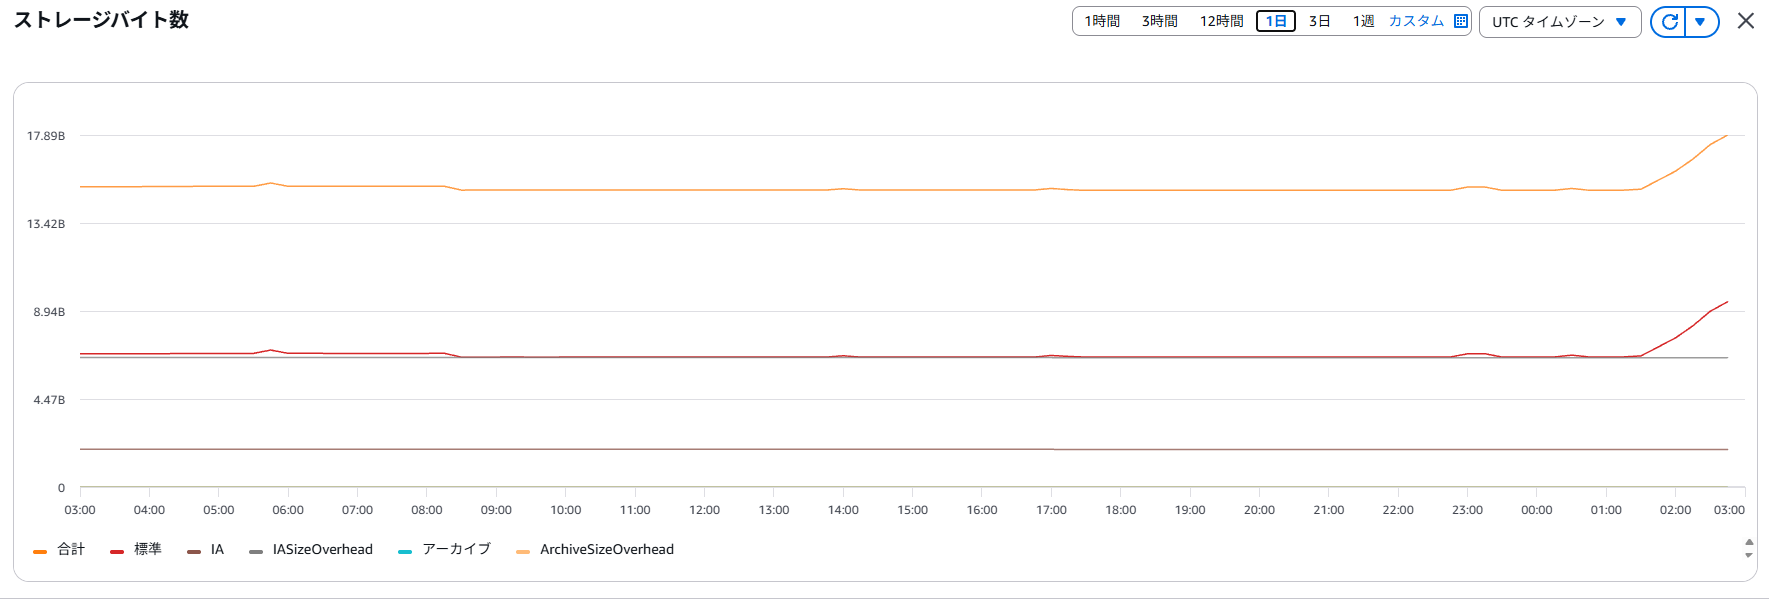
- Storage Bytes: Increasing trend since 00:00 (14GB → around 17GB)
"This is it."
EFS is reaching its throughput limit. Moreover, it's not data read/write, but metadata operations consuming the IOPS. And the storage capacity keeps increasing.
Honestly, I got stuck here.
The capacity itself is around 17GB, which is not particularly large. Yet, why are there frequent spikes reaching 100% throughput? What exactly does metadata IOPS refer to?
What is Metadata IOPS?
After some research, I found that "metadata operations" in EFS refer to things like:
- File stat (checking size and timestamps)
- Directory ls
- File creation and deletion
- Permission changes
In other words, operations that create, delete, and check large numbers of small files consume metadata IOPS.
What in a Jenkins environment falls into this category?
- Build logs
- Build artifacts
- Git repository cache
- Shared Library clones
- fingerprints (artifact tracking data)
All of these consist of many small files. Git repositories in particular have a huge number of files under .git/objects.
"I see, it's not a capacity issue, but a file count issue."
Narrowing Down the Suspects
Since EFS storage capacity was showing an increasing trend, I thought "something is accumulating."
First, I checked the size of each directory in /mnt/efs/jenkins.
du -sh /mnt/efs/jenkins/*
Result:
342M    plugins
106M    war
332M    logs
373M    caches
timeout jobs       # Timeout
174M    fingerprints
timeout config-history
The jobs directory timed out. This is suspicious.
However, I noticed something here.
plugins:         342M
war:             106M
logs:            332M
caches:          373M
fingerprints:    174M
Total:           About 1.3GB
About 15.7GB still undiscovered
The total EFS capacity is around 17GB, but I could only account for about 1.3GB. Large files or directories must be hiding somewhere.
Emergency Measure: Setting Provisioned Throughput
Since the investigation was taking longer, I made a decision at this point.
"I want to keep Jenkins running during the investigation. The best approach would be to increase EFS throughput."
EFS has the following throughput modes:
- Bursting: Performance degrades when credits are depleted based on storage capacity
- Provisioned: Set a fixed throughput value
- Elastic throughput: Automatically scales based on demand, billed for usage
The setting at that time was bursting mode, but I decided to change it to provisioned throughput of 300 MiB/s.
However, I found out that EFS throughput mode changes have restrictions and couldn't be changed immediately. I decided to change the settings the next day.
Why did I choose provisioned throughput?
- Stable performance → Predictable performance against metadata IOPS spikes
- Peace of mind during investigation → Throughput guaranteed even when running find or du
- Immediacy → No need to wait for bursting mode credit recovery
Whether this decision was correct would be confirmed after changing the settings the next day.
However, this is merely an emergency measure. The root cause has not been resolved.
Discovery of the True Culprit: Leftover Git Temporary Files
I continued the investigation.
I decided to directly search for large files.
find /mnt/efs/jenkins -type f -size +100M 2>/dev/null -ls
Then—
125829120 Jan 27 01:50 /mnt/efs/jenkins/jobs/Seed_Jobs/jobs/0_Seed_Job_Orchestrator/builds/873/libs/.../root/.git/objects/pack/tmp_pack_S3GPJw
122683392 Jan 27 01:50 /mnt/efs/jenkins/jobs/Seed_Jobs/jobs/0_Seed_Job_Orchestrator/builds/872/libs/.../root/.git/objects/pack/tmp_pack_c4EAwd
A large number of temporary files named tmp_pack_* were left behind.
Each file was 100-300MB. Many had today's (Jan 27) timestamp.
"This is it."
What Was Happening?
To summarize, this is what was happening:
During Pipeline Shared Library Checkout
- Jenkins performs git clone of the Shared Library
- Git generates temporary files (tmp_pack_*) when creating pack files
- Timeout due to EFS IOPS limit
- Temporary files remain without being deleted
Same Phenomenon with Every Build
- Occurs during the build that runs daily at 23:12
- Each build leaves behind 200-300MB of garbage
- This accumulates over dozens of builds = About 15GB
Vicious Cycle
EFS slow → Git fails → Garbage accumulates → EFS gets even slower
I see, that's why the symptoms suddenly manifested today.
Response and Remaining Tasks
Once the cause was identified, the urgency decreased. So, I first tackled creating a periodic cleanup job as a recurrence prevention measure.
Actions Taken
Created Periodic Cleanup Job
- Set up a job to automatically delete tmp_pack_* files older than 1 day
- Built a mechanism to prevent the same issue from occurring in the future
Remaining Tasks
Now that the cause has been identified and recurrence prevention measures have been taken, things have settled down for now, but the following tasks remain:
Delete Temporary Files
systemctl stop jenkins find /mnt/efs/jenkins -name "tmp_pack_*" -type f -delete systemctl start jenkins- Clean up the existing ~15GB of garbage files
Set Up Monitoring Alerts
- Alert when EFS throughput utilization exceeds 75%
- Mechanism for early detection
Through this investigation, I noticed several things.
Insight 1: Problems That Can't Be Seen by Looking at Capacity Alone
I had thought "no problem because capacity is low," but in reality, the accumulation of large numbers of small files was the cause of performance degradation. I realized that the number of files and frequency of metadata operations are more important than capacity.
Insight 2: Bursting Mode is Weak Against Unpredictable Loads
EFS bursting mode degrades performance when credits are depleted. With problems that accumulate "without you noticing" like this time, it's difficult to predict when credits will be exhausted.
Insight 3: Leave Room to Continue Operations During Investigation
The decision to switch to provisioned throughput was insurance to keep Jenkins running stably during the investigation. I felt the importance of taking preemptive action with the assumption that "the investigation might take longer."
Reflection
At first, I thought "it's probably a temporary network issue."
But in reality, the cause was not the network, not disk capacity, but metadata IOPS—and specifically, the unexpected accumulation of Git temporary files.
Forming hypotheses and verifying them, and when proven wrong, switching to different hypotheses. Reading through metrics, getting closer to the truth step by step. There were points where I honestly got stuck, but when I finally identified the cause, I could understand it clearly like "ah, that's what it was."
Behind the surface symptom (Git clone error), there was a deeper cause (EFS metadata IOPS), and behind that was the true culprit (accumulation of Git temporary files).
Forming and verifying hypotheses carefully, one by one. I felt once again that this accumulation is what's important.
Future Actions
In this incident, while we could identify that EFS capacity was increasing, we couldn't immediately pinpoint the root cause.
The tmp_pack_* deletion job has already been created, but to detect similar issues early in the future, we plan to advance EFS usage visualization.
Specifically, we will build a mechanism to periodically monitor directory-level usage and visualize it as reports, enabling early detection of abnormal capacity increases. This will allow us to address issues before they manifest as problems.
Related Books
Here are recommended books for those who want to learn more about infrastructure operations and troubleshooting like this case.
[📦 商品リンク: moshimo-book-sre-google]
[📦 商品リンク: moshimo-book-jenkins-jissen]
[📦 商品リンク: moshimo-book-aws-operations]