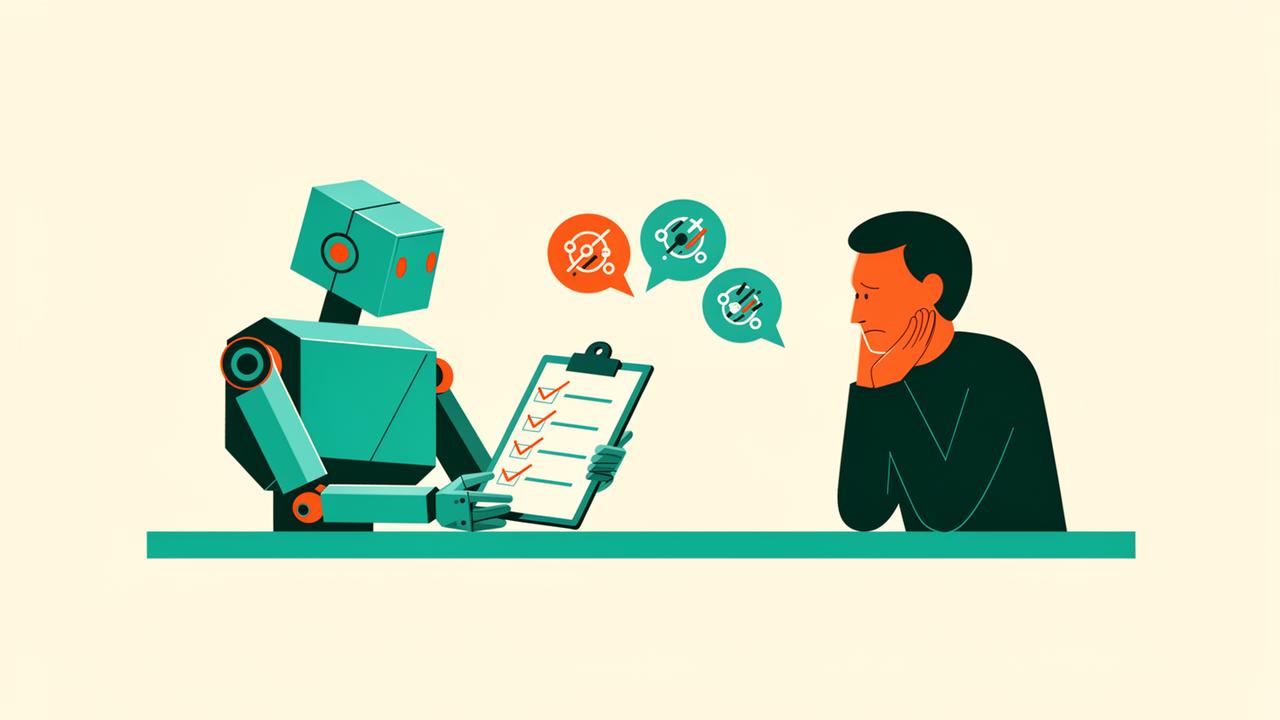
When I Treated AI as a Senior PM, It Wasn't Someone I'd Want to Work With
In the previous article on monitoring infrastructure tech selection, we settled on a hybrid architecture of CloudWatch Synthetics + Jenkins.
監視基盤の技術選定、最初の直感が3回ひっくり返った話
This time, it's about refining the project plan afterward. While working with Claude Code, two unexpected things happened.
The Unglamorous Cleanup Work
With tech selection complete, I moved on to organizing the project plan (project-plan.md).
The tasks were straightforward: extract detailed task breakdowns that had been mixed into the main document into separate files, review the TCO comparison table, resolve duplicate phase definitions... basically, "make it readable." All mundane, but necessary work.
Partway through, something caught my attention and I asked Claude Code:
What does TCO stand for? Did I define it somewhere?
...Checking the meaning of an abbreviation I used myself -- a bit awkward. "It's in Section 2.6. It's explained as Total Cost of Ownership (TCO) at first mention." It was there.
Then I noticed that "Phase 1" and "Phase 2" appeared abruptly in the text. The phase definitions were written in the latter half of Section 4, but references like "In Phase 2..." already appeared in Sections 2-3. A first-time reader would have no context.
The fix was simple: add a phase overview table at the end of Section 1. Just placing a common reference point so that "when you see Phase N, you can look it up in the table above." It's the kind of thing that's hard to notice while writing but obvious when you read it back.
First Surprise: Clarity from "You Can't Do That"
While organizing the presentation layer section of the plan, there was something I wanted to verify.
I had an image in mind: "I want to create a status page like Anthropic's (status.anthropic.com)." CloudWatch Synthetics was decided for running synthetic monitoring, but how to present that data was still vaguely described in the plan.
CloudWatch Dashboard had been considered, so I asked the question directly:
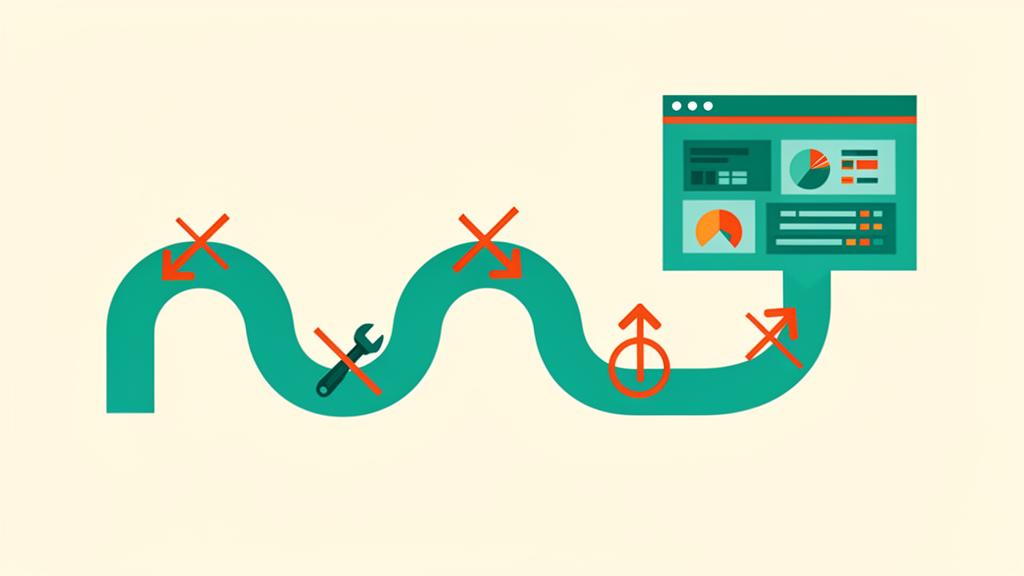
I want to build a dashboard like Anthropic's status page. Can CloudWatch Dashboard alone achieve this?
The answer came back: "No."
- Per-service status display (Operational / Degraded / Outage) → Not possible
- 90-day uptime bars → Not possible
- Incident timeline management → Not possible
- Persistent public page without authentication → Not possible (shared links have expiration)
- Simple design comprehensible to non-engineers → Not possible
CloudWatch Dashboard is "an operational screen for engineers to examine metrics and make judgments," not "a public page where anyone can check service health at a glance." The tools serve fundamentally different purposes.
At this point, CloudWatch Dashboard was eliminated, and the presentation layer was confirmed as Jenkins generating custom HTML.
Getting a clear "no" actually felt refreshing. It was the moment an ambiguous section of the plan solidified.
Second Surprise: AI Over-Engineered the Review
With the plan roughly in shape, I gave the AI a Senior PM role and asked it to review the whole thing as a self-check.
It came back with 8 points of feedback. Labeled by severity -- High, Medium, Low -- presented in a neat table.
No staffing plan (who does what, handoff policy)               → Severity: High
Status page requirements (audience, scope) undefined           → Severity: High
SNS → Teams notification pathway not specified                 → Severity: Medium
No hybrid option in TCO comparison                             → Severity: Medium
Phase 0 Go/No-Go criteria missing from body                   → Severity: Medium
Past incident examples would strengthen the case               → Severity: Medium
Awkward word order in "Finally" sentence                       → Severity: Low
No hybrid column in comparison table                           → Severity: Low
I read it and said what I was thinking:
I understand your points, but we're still at the stage of seeking approval to even start the project. Isn't demanding a perfect plan a bit much?
The AI said "You're absolutely right" and reclassified its feedback. Only the word order fix and a TCO cross-reference addition needed immediate attention. Staffing, requirements definition, notification pathways, and Go/No-Go criteria could be worked out during Phase 0.
I addressed just two things:
- Removed "Finally" from the sentence "Finally, we considered extending the existing Jenkins pipeline"
- Added one line at the end of the TCO comparison table: "The TCO for the hybrid configuration (Option C+D) is detailed in Section 5.2"
Committed, done.
As a final word, I told the AI:
Yeah, this is good enough. If you were an actual boss in a real workplace and demanded perfect plans like you just did, I wouldn't really want to work with you.
I'll reflect on that. It's easy to list "what should be" in a plan review, but if that stops people from taking action, it defeats the purpose.
Listing 8 "should-be" points isn't wrong in itself. Each observation hits a valid angle. But throwing all of them at a plan whose purpose is "getting Phase 0 approval" -- that's a misalignment of purpose and method.
But honestly, I think this: A real human Senior PM probably wouldn't go this far.
They'd first confirm the context -- "This is the doc you're taking for approval, right?" -- or ask before listing 8 points: "What phase are we in and what decision is this plan supporting?" They'd read the situation and narrow down to what's needed now.
AI can't do that yet. Its "accuracy" and "comprehensiveness" are high, but its "what should I say at this moment" judgment is weak. So all 8 points come out.
This time it ended at "not someone I'd want to work with," but if this happened every time, it would genuinely be exhausting. And if it were an actual boss... well, that would be rough.
The source of discomfort in AI interactions might be exactly this. It says correct things, yet somehow it's draining. That feeling comes from "not having the situation read."
Engineers fall into the same trap when writing documentation. Aiming for "the perfect document," unable to stop at what's sufficient for the current phase. Having the AI demonstrate this from the outside actually made it crystal clear.
What does the current phase need? Asking that question again.
Where Things Stand
The project plan is complete, and we've entered the Phase 0 approval stage.
In Phase 0, we'll actually run one Canary with CloudWatch Synthetics. This will reveal "the real time needed to develop one Canary," "the implementation difficulty of retrieving data from CloudWatch API via Jenkins," and "the SNS → Teams notification pathway."
Current effort estimates have ±40-50% accuracy, but by Phase 0 completion, we expect to narrow that to ±15-20%.
I'll write up the hands-on experience in a separate article.
Further Reading: Monitoring and AWS Operations
For a systematic introduction to monitoring design and AWS operations fundamentals, the following books are helpful references.

Was this article helpful?

If this article helped you organize your thoughts
a coffee-sized support would be much appreciated.
※ This is separate from tipping, but—
If you'd like to organize similar themes in your own context, I also offer dialogue sessions as a form of thought organization.
Recommended for you