SRE Work: From Problem Discovery to Permanent Solution and Results
Introduction
We've been tracking the Jenkins EFS issue through three articles:
- Part 1: How Jenkins Gradually Stopped Git Cloning - Problem discovery and emergency response
- Part 2: Spending $10,000 on Provisioned Throughput - Dealing with costs
- Part 3: The Problem Surfaced on 1/26, But Root Cause Was on 1/13 - Root cause discovery
And today, we have results from our solution.
Honestly, I didn't expect such clear results. When I saw the graph, I felt a sense of "ah, my hypothesis was correct."
This article reports on post-solution results and explores the SRE workflow process that emerged from this entire response.
Post-Solution Results: Dramatic Improvement
In Part 3, we enabled Shared Library caching. Here's the EFS throughput utilization graph afterward:
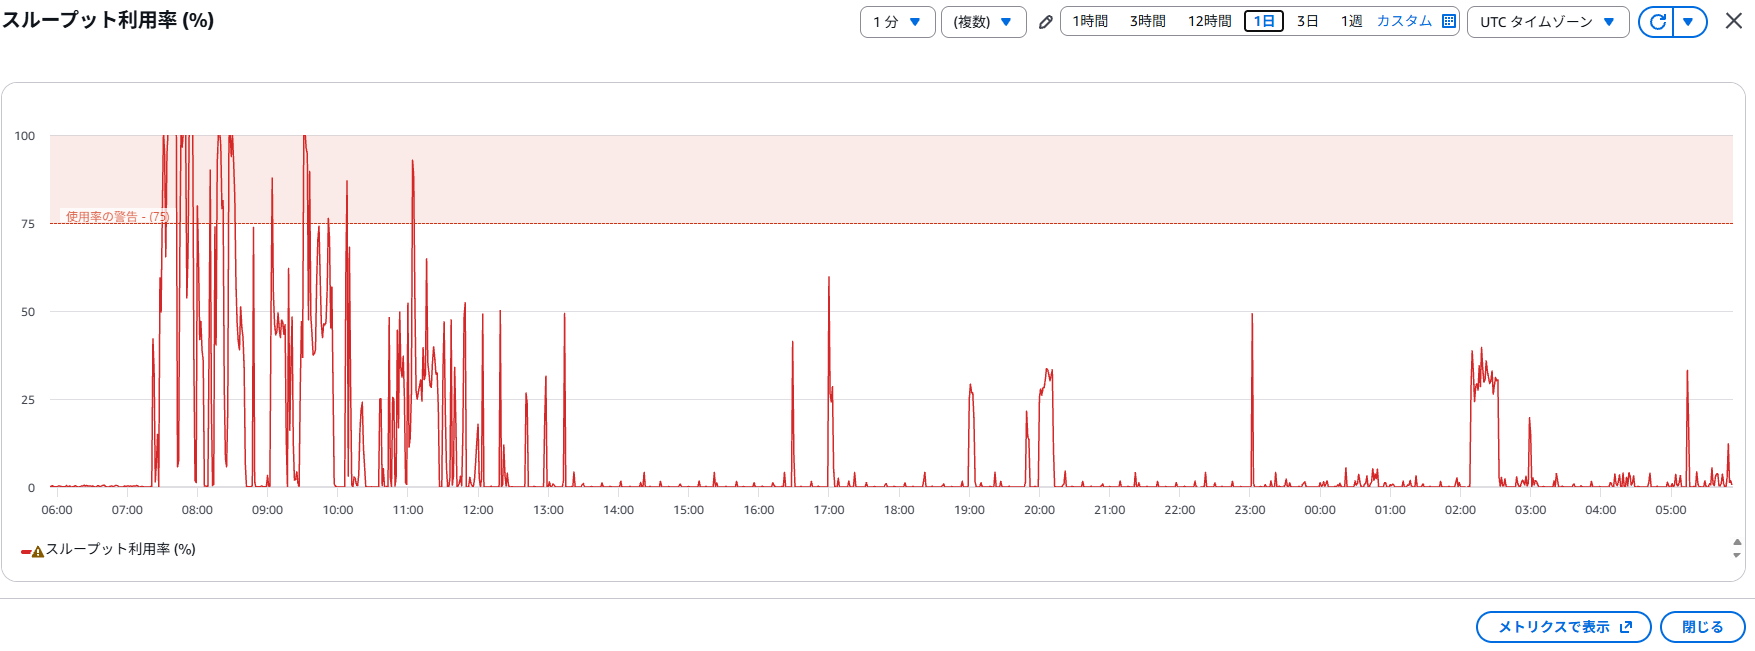
Before (left side, 06:00-12:00):
- Throughput utilization frequently spiking to 100%
- Nearly constant high load
- Far exceeding the warning zone (75%)
After (12:00 onward):
- Throughput utilization dramatically decreased and stabilized
- Baseline near 0%
- Regular small spikes every 3 hours (max ~60%)
- Operating as configured
The 3-hour spikes are from Shared Library cache refresh checks (Refresh time: 180 minutes). In other words, it's working as expected.
Complete Record of Throughput Mode Transitions
Let's organize the five throughput mode transitions we went through during this response.
Timeline
Details and Costs of Each Mode
| Mode | Duration | Cost | Reasoning |
|---|---|---|---|
| Burst | Until 1/27 | Storage only | Normal operation |
| Provisioned 300 MiB/s | 1/27 (26 hours) | ~$69 | Emergency: Ensure investigation work |
| Elastic Throughput | 1/28-1/29 (~1 day) | ~$8 | Cost reduction: Usage-based billing |
| Provisioned 10 MiB/s | 1/30-present | ~$2.3/day | Validation: Stable at low cost |
| Burst (planned) | Soon | Storage only | Permanent: Return to original |
Why We Changed from Elastic Throughput
Actually, we discovered that Elastic Throughput "costs more than expected."
One day of usage was ~$8. That's about $240/month (~35,000 yen).
In contrast, Provisioned 10 MiB/s costs only ~$72/month (~10,000 yen). Given our current usage pattern (average throughput a few %, max 60%), 10 MiB/s is sufficient.
However, this is just a validation period setting. We plan to eventually return to Burst mode.
Hypothesis Validation and Revision
Let's validate the hypothesis we posed in Part 3.
Original Hypothesis
Did the change to disposable agent mode (1/13) massively increase metadata IOPS?
This hypothesis was partially correct, but not the main culprit.
The Actual Culprit
Shared Library caching was disabled (existed from before)
Simply enabling caching brought throughput utilization down to nearly 0%. This means that Shared Library's full fetch on every build was overwhelmingly consuming metadata IOPS.
Impact of Disposable Agent Mode
So, was disposable agent mode unrelated?
Not quite. The change to disposable agent mode was one factor that accelerated Burst Credit depletion.
- Shared Library cache disabled (from before) → Metadata IOPS consumption on Controller side per build
- Disposable agent mode (from 1/13) → Metadata IOPS consumption on Agent side per build
- Increased development activity after New Year → More builds
These three factors combined caused rapid Burst Credit depletion from 1/13, with symptoms surfacing two weeks later on 1/26.
With only the Shared Library cache disabled, credit might have decreased more slowly. The disposable agent mode change was likely the final push that tipped things over.
The SRE Workflow
Reflecting on this entire response, we can see a clear process in SRE work.
1. Problem Discovery (1/27 morning)
- Symptoms: Slow Jenkins, Git clone failures, 504 errors
- Metrics check: EFS throughput utilization 100%
- Time required: ~30 minutes
At this stage, understanding "what's happening" is crucial.
2. Emergency Response (1/27 morning)
- Decision: Change to Provisioned throughput 300 MiB/s (next day)
- Purpose: Ensure investigation work can continue
- Trade-off: High cost vs. continued investigation/development
Emergency decisions prioritize "avoiding worst-case scenarios." Costs can be explained later, but losses from development stoppage are irreversible.
3. Impact Minimization (1/27 afternoon)
- Created periodic cleanup job
- Planned
tmp_pack_*deletion - Implemented recurrence prevention
In parallel with emergency measures, implement prevention strategies.
4. Root Cause Investigation (1/27-1/30)
- Stage 1: Discovered
tmp_pack_*accumulation - Stage 2: Burst Credit Balance graph analysis revealed 1/13 as origin
- Stage 3: Discovered Shared Library cache was disabled
Honestly, I got stuck here. When I found tmp_pack_*, I thought "this is the cause," but it was actually just part of the symptoms.
By reviewing graphs chronologically, we reached the true root cause.
5. Permanent Solution (1/30)
- Enabled Shared Library caching
- Set Refresh time: 180 minutes
- Considered throughput mode optimization
Once the root cause is identified, the solution is simple.
6. Effect Measurement (1/30-)
- Confirmed dramatic improvement in throughput utilization
- 3-hour spikes as expected
- Continued observation needed
Results prove whether the solution was correct.
7. Retrospective & Knowledge Sharing (this article)
- Reflection on cost decisions (didn't know about Elastic Throughput)
- Understanding compound causes
- Knowledge transfer to organization
This is surprisingly critical. Don't just solve the problem and move on—verbalize "why it happened" and "how we decided," and apply it next time.
Remaining Issues and Future Plans
Short-term Issues
1. Return to Burst Mode
We're currently running on Provisioned 10 MiB/s, but plan to eventually return to Burst mode.
Before returning, check:
- Burst Credit Balance has sufficiently recovered
- No new
tmp_pack_*files are being generated - Cleanup job is functioning properly
2. Enhanced Monitoring
This is a complete lesson learned. With proper monitoring, this problem could have been detected earlier.
Alerts to configure:
- EFS throughput utilization > 75%
- Burst Credit Balance < threshold (TBD)
- Abnormal storage capacity increases
3. Continued Cleanup Job Operation
We created the periodic cleanup job, but need to regularly verify that tmp_pack_* files are actually being deleted.
Long-term Considerations
1. Reconsider Disposable Agent Mode
We're currently continuing disposable agent mode, but the metadata IOPS impact is non-negligible.
Options to consider:
- Slightly extend agent lifecycle for reuse across multiple jobs
- Share Git cache on EFS across all agents
- Place cache on S3 and sync on startup
How to balance cost and performance—that's the next challenge.
2. Reconsider EFS Usage
There's also a fundamental question: is placing Jenkins' work directory on EFS optimal?
Alternatives:
- Migrate to EBS-based storage
- Place only critical data on EFS
- Differentiate between S3 and EFS usage
However, this would be a major architectural change requiring careful consideration.
Summary: What Is SRE Work?
Looking back, arranging this entire response chronologically revealed some insights.
Technical Learnings
- EFS Metadata IOPS Characteristics
- Large-scale operations on small files are critical
- File count matters more than storage capacity
- Burst Credit management is key
- Jenkins Caching Mechanisms
- Importance of Shared Library caching
- Balancing Refresh time settings
- Hidden costs of cache disabling
- Throughput Mode Selection
- Elastic Throughput isn't a silver bullet
- Optimization based on usage patterns
- Importance of cost estimation
Process Learnings
But what's more important is "how we decided."
Emergency Decision-Making:
- Make decisions without perfect information
- Prioritize avoiding worst-case scenarios
- Clarify trade-offs
Investigation Approach:
- Look at graphs chronologically, not just symptoms
- Form hypotheses, validate, and move to the next if wrong
- Acknowledge "honestly, I got stuck here"
Accountability:
- Costs can be explained afterward
- Verbalize decision processes
- Share failures as well
These three are the greatest learnings from this response.
When in Doubt, Choose the Harder Path
Finally, on a personal note.
Not knowing about Elastic Throughput was clearly a knowledge gap. The $64 difference is significant.
But I believe the decision itself—"ensuring an environment to continue investigation"—was correct. I regret not knowing, but the decision process can be applied next time.
When in doubt, choose the harder path, the one that leads to growth—this is a principle I always value.
In this response, the easier choice would have been "stop Jenkins and investigate over the weekend." But by choosing the harder path of "continuing operation while investigating," I experienced the complete process of emergency response, cost decisions, and root cause identification.
The $69 tuition might have been expensive. But I believe I gained more than that in learning.
Related Articles
This article is a continuation of the following three articles:
Related Books
For those interested in learning more about infrastructure operations and troubleshooting:

Was this article helpful?

If this article helped you organize your thoughts
a coffee-sized support would be much appreciated.
※ This is separate from tipping, but—
If you'd like to organize similar themes in your own context, I also offer dialogue sessions as a form of thought organization.
Recommended for you