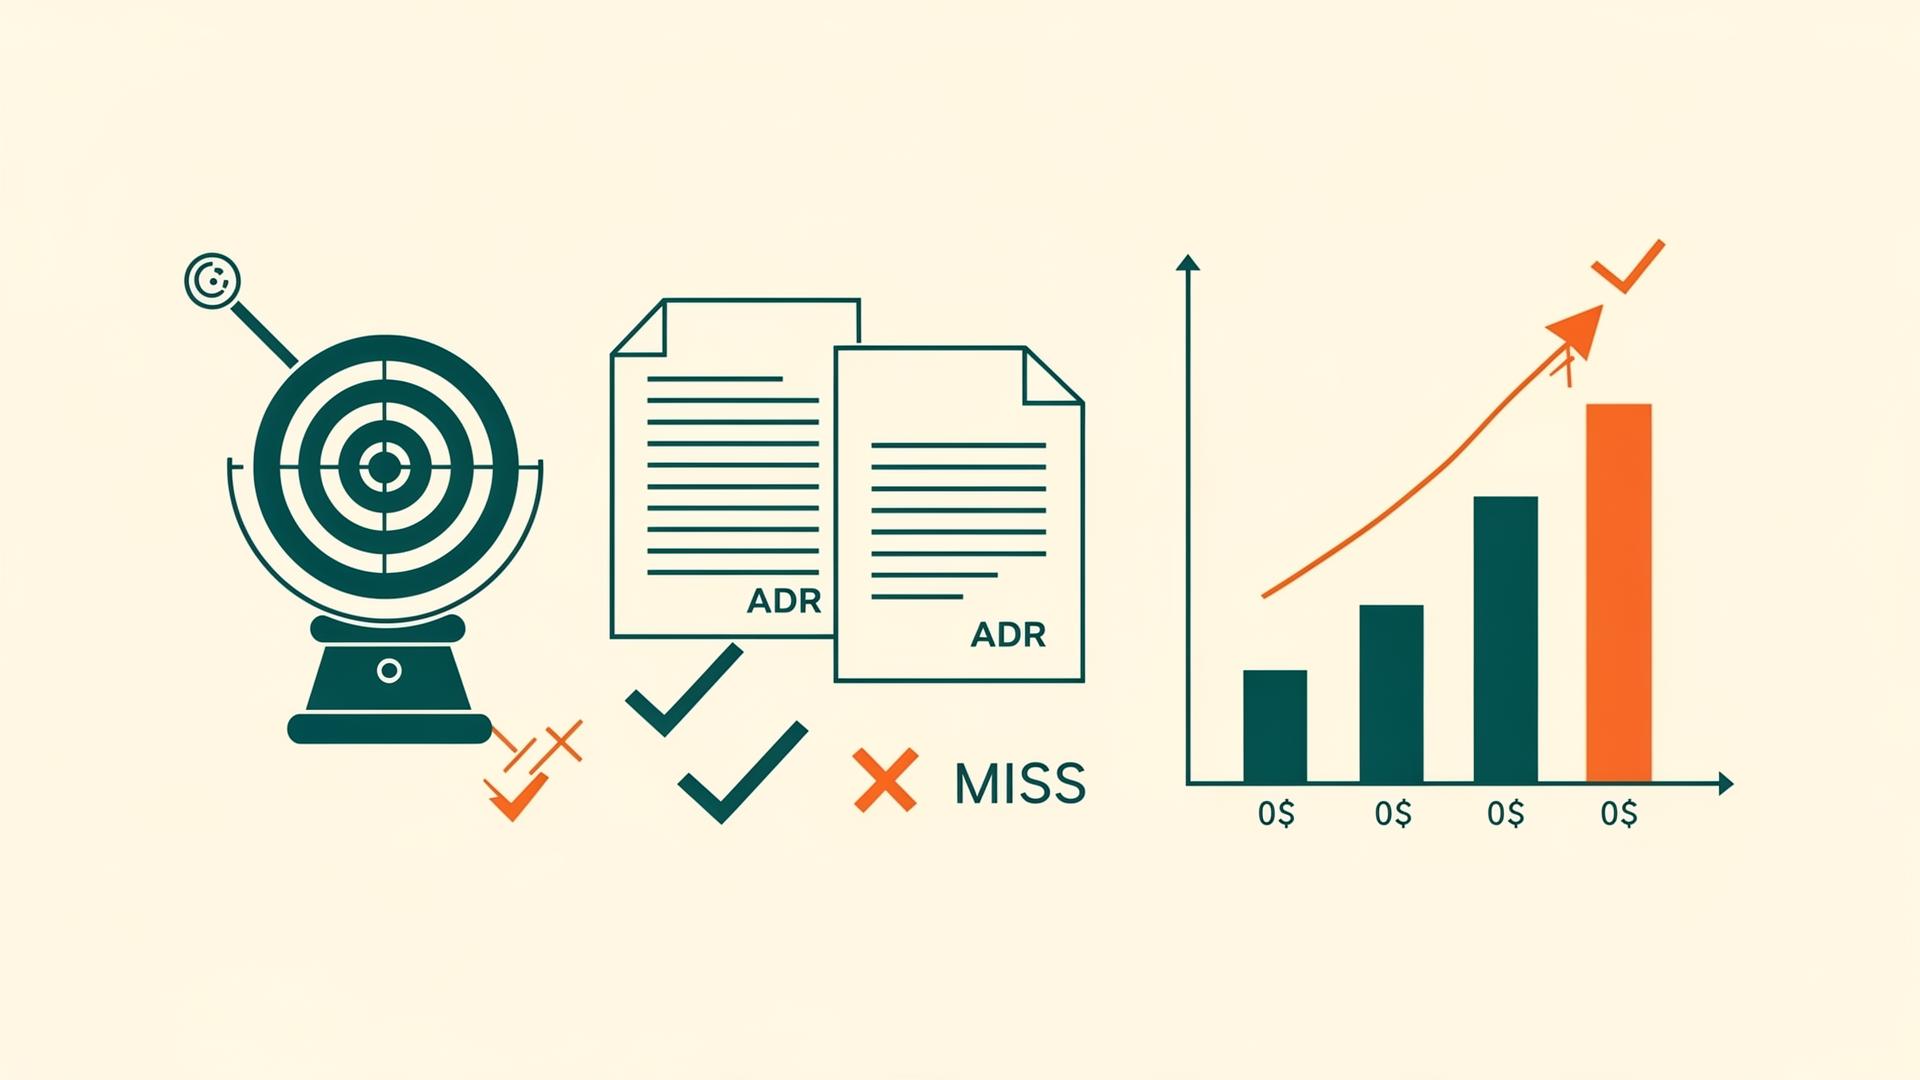
Building a System to Measure ROI of Proactive Design
A challenge came up in our project:
For systems we've built in the past, we want statistics on how often parts built with "this will be needed someday" or "business will likely request this" actually got used.
While YAGNI (You Aren't Gonna Need It) says don't build ahead, we want data to support whether building ahead has value.
I thought this was a great theme, so I explored it. Honestly, there are still rough edges.
The Core Problem (I Think)
What we really want to know is:
For implementations built based on "this will be needed someday" predictions, what percentage actually came true?
Breaking this down, there are three evaluation axes:
| Perspective | Details |
|---|---|
| ① Prediction | The hypothesis "requirement ◯◯ will come" |
| ② Implementation | Code/design built to prepare for it |
| ③ Reality | Did that requirement actually come / get used? |
In other words, we want to measure "Prediction × Hit Rate".
Between YAGNI and Proactive Design
YAGNI (You Aren't Gonna Need It) means "not needed now," not "never needed."
The problem is paying heavy costs upfront when prediction accuracy is low.
So how do we distinguish acceptable proactive design from unacceptable? I thought about this.
Areas Where Proactive Design Might Be Acceptable
- Extension point "buffers"
- interface / hook / plugin point
- Database design isolation
- Forms resilient to field additions
→ Low cost, small damage when wrong
Areas Where Proactive Design Is NG
- UI
- Complex business logic
- External integration specs
- Authorization/billing logic
→ Rebuild guaranteed when wrong
Honestly, I'm not fully confident about these boundaries yet.
The Estimation Accuracy Problem
This is where I got stuck.
I thought we could express the value of proactive design like this:
Value = (Probability × Cost Saved Then) − Cost Paid UpfrontBut thinking carefully, we can't estimate this accurately, can we?
- No one knows actual occurrence probability
- Reactive costs are unknowable until you actually do it
- Even upfront costs swell during implementation
Moreover, if we could estimate accurately, we might not even need this framework.
So what do we do?
Even Imperfectly, We Can Make Relative Judgments
Estimation accuracy might not be necessary.
What's important is:
- Learning "this area predicts well" or "this area predicts poorly"
- Grasping trends of "proactive was better" or "reactive was better"
For example, something like:
| Area | Hit Rate | Trend |
|---|---|---|
| Database design | 70% | Proactive OK? |
| UI specs | 20% | YAGNI recommended? |
| External integration | 10% | Absolutely YAGNI? |
This organizational knowledge accumulation has value.
But honestly, I won't know if this works until trying it.
Numbers Are "Learning Material" Not "Absolute Truth"
So the goal isn't improving estimation accuracy.
The goal is recording decisions, comparing with results, and learning.
- "We estimated 20 person-days then, but it was actually 5"
- "We thought 30% probability, but it came in 3 months"
Knowing these gaps improves next decisions.
Design for Measurability (Proposal)
Explicitly Tag Proactive Implementations
First, we need to "keep proactive implementations with intent."
For example, recording in ADR (Architecture Decision Record) like:
## Context
Customer-specific permission management might be needed

## Decision
Stick with simple role model for now

## Forecast
- Estimated probability: 30% (based on sales hearing)
- Estimated reactive cost: 20 person-days (rough)
- Estimated proactive cost: 4 person-days (rough)
- Decision: Don't build now (expected value seems negative)
Estimates should be rough. What's important is recording the decision rationale.
Compare Predictions with Reality
After 6 months to 1 year, how about this kind of review:
| Forecast ID | Content | Est. Prob | Actual | Est. Cost | Actual Cost | Result |
|---|---|---|---|---|---|---|
| F-001 | CSV bulk upload | 30% | Came after 6mo | Reactive 15PD | Actually 1PD | Hit & overestimate |
| F-002 | Multi-language | 50% | Didn't come | - | - | Miss |
| F-003 | Enhanced auth | 20% | Came in 3mo | Reactive 20PD | Actually 25PD | Hit & underestimate |
What to look at is not absolute accuracy, but trends and gap reasons.
- F-001: Why did we overestimate cost?
- F-002: Why did it miss? Sales reading too optimistic?
- F-003: Why did it come early despite low estimated probability?
I'm honestly unsure if this analysis is actually doable.
Quantification Should Drive Discussion
For example:
- Proactive implementations: 20 cases
- Requirements actually came: 6 cases
- Came earlier than expected: 3 cases
- Came later than expected: 2 cases
- Haven't come yet: 14 cases
→ Requirement hit rate: 30%, early arrival rate: 50%
The numbers themselves aren't what matters—it's learning "our predictions are too optimistic" or "this area is more predictable".
What Management Wants to See (Probably)
CTOs and management probably don't care about design details.
They likely want to see:
- Proactive Success Rate
Percentage of proactive requirements that actually materialized
- Cost Reduction Effect Trends
How much effort proactive design saved (roughly)
- Proactive Learning Curve
Is prediction accuracy improving over time?
Something like this, but I'm not certain.
Implementation Image (For Our Environment)
For our environment, this seems realistic:
Overall Flow
Each Repository (ADR + metadata.json)
  ↓
Jenkins (cross-repo scan, diff collection)
  ↓
S3 (aggregated JSON)
  ↓
Microsoft Fabric (analysis, visualization)
  ↓
Dashboard
We already have a mechanism where Jenkins aggregates code complexity per repository and creates overall reports. We can build on this.
Metadata Design
ADR bodies can be free-form. However, aggregation metadata needs standardization.
Minimum required items:
- ADR ID (unique identifier)
- type (forecast: proactive decision)
- Estimated probability (0–1)
- Estimated cost (proactive/reactive)
- Status (pending / hit / miss)
- Actuals (requirement date, actual cost)
Store this as JSON format.
Treat estimates as "estimate," not accurate truth—just record the decision.
Diff Collection
Full scanning every time would be heavy, so collect only diffs:
- Record
commit SHAfrom last scan - For each repo:
git diff --name-only <prev>..<now> - Collect only added/updated
*.meta.json
We can reference the existing complexity aggregation mechanism here.
When Do We Know "Proactive Was Worth It"?
I also thought about this.
"The moment users use it" is only part of the result—it doesn't alone prove "proactive was worth it."
I think we need three judgment timings:
① Moment Requirement Occurs
"Did that requirement actually come?"
At this point we can only say:
- Didn't come → Proactive was wrong
- Came → Proceed to next judgment
Can't yet say "worth it."
② Moment Implementation/Lead Time Is Seen (This Seems Key)
| Case | Additional Work |
|---|---|
| With proactive | 1 person-day |
| Without proactive (assumed) | 10 person-days |
"How quickly and cheaply could we respond to that requirement?"
At this moment, we can first say "proactive was correct."
Whether users used it is still irrelevant, I think.
③ Moment User Value Is Created
- Usage rate increased
- Churn rate decreased
- Deal closed
This evaluates "did proactive design contribute to value creation," but marketing, sales, timing, and competitors all factor in—too late for technical judgment.
What's fair for technical judgment is ② the response cost difference when requirement occurs.
Excel Management Will Fail (Probably)
There was a question: "Just writing ADRs and managing updates doesn't visualize anything. Collect them in Excel?"
Excel management fails because:
- Update timing is distributed
- Who updates is unclear
- Diverges from decision log
- No one looks at it
Excel tends to become "done once, forgotten."
So we need to treat ADRs as "input devices" and visualization as a "separate layer"—run it as a system.
Don't Aim for Perfection
The goal of this framework isn't perfect estimation or perfect prediction.
The goal is:
- Recording decisions
- Comparing with results and learning
- Improving prediction accuracy as a project
Missing estimates isn't bad. Making the same decision next time without knowing you missed is the problem.
Treat numbers as "learning material," not "absolute truth."
Next Actions
Having thought this through, I'll propose it to the project.
Specifically:
- Finalize metadata.json schema
- PoC with 2-3 repositories
- Build Jenkins → S3 → Fabric flow
- First output "hit rate" and "estimation gaps"
- Run for 3 months, verify learning occurs
I don't know if this will actually work, but I hope it transforms proactive design from "individual skill" to "organizational capability."
Related Books
For organizational decision-making and technical strategy, this book is also helpful.

Was this article helpful?

If this article helped you organize your thoughts
a coffee-sized support would be much appreciated.
※ This is separate from tipping, but—
If you'd like to organize similar themes in your own context, I also offer dialogue sessions as a form of thought organization.
Recommended for you